
Figure 1. Kaplan-Meier overall survival curve for HCC patients based on rs3754093 genotypes.
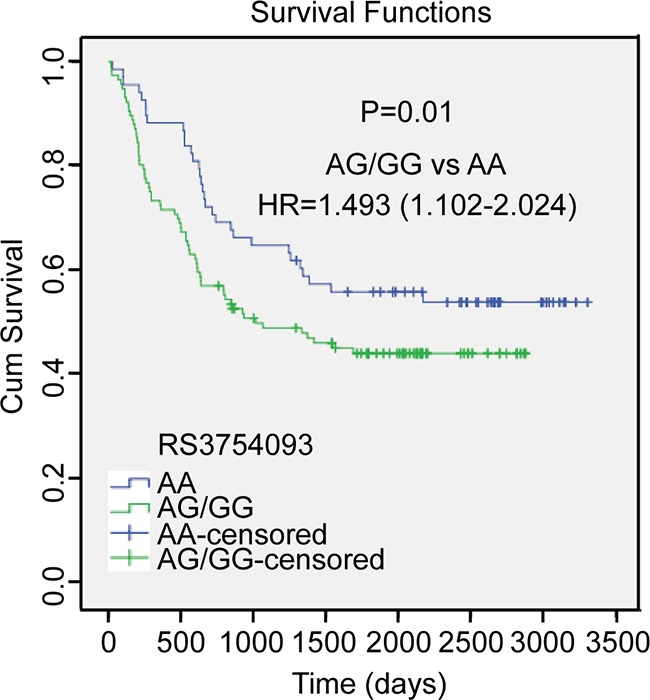
P value is from the log-rank test. HR with 95% CI was from univariate analysis of OS and DFS.
Official websites use .gov
A
.gov website belongs to an official
government organization in the United States.
Secure .gov websites use HTTPS
A lock (
) or https:// means you've safely
connected to the .gov website. Share sensitive
information only on official, secure websites.
P value is from the log-rank test. HR with 95% CI was from univariate analysis of OS and DFS.