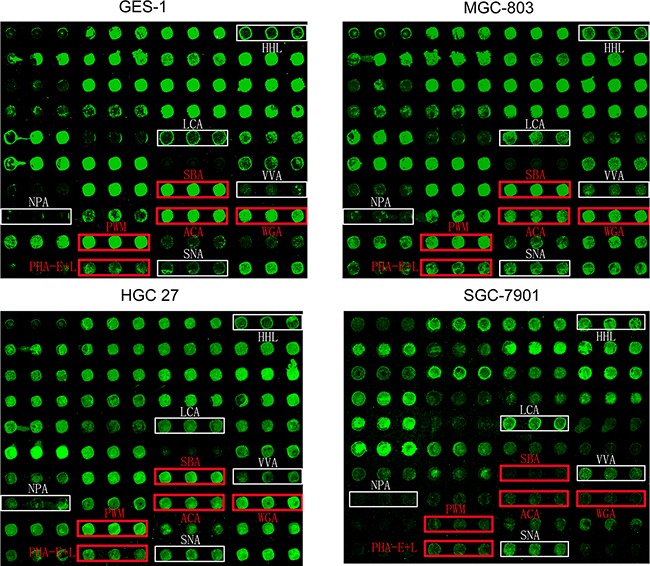
Figure 1. Glycan profiles of gastric cancer and normal gastric cell lines obtained by lectin microarray analysis.

Differentially expressed glycans in three gastric cancer cell lines (SGC-7901, HGC-27, and MGC-803) and one normal gastric epithelial cell line (GES-1). White boxes: fluorescence intensities of lectins higher in gastric cancer cells. Red boxes: fluorescence intensities of lectins lower in gastric cancer cells. Each sample was observed consistently by three repeated slides. One representative slide was shown.
