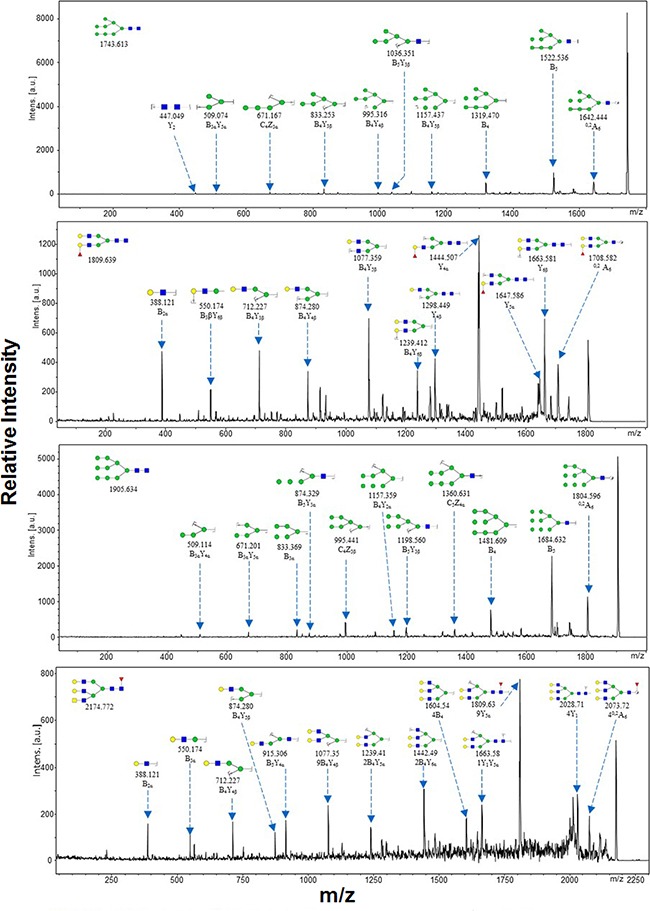
Figure 4. MALDI-TOF/TOF-MS/MS analysis of N-glycan precursor ions in MS spectra of the four cell lines.

Precursor ions were subjected to MS/MS analysis to obtain cleavages, including B, Y, C, and Z glycosidic cleavages and A and X cross-ring cleavages. Structures of cleavage ions and m/z values are shown in tandem mass spectra. The four major N-glycan peaks are: 1743.613 m/z, 1809.639 m/z, 1905.634 m/z, and 2174.772 m/z.
