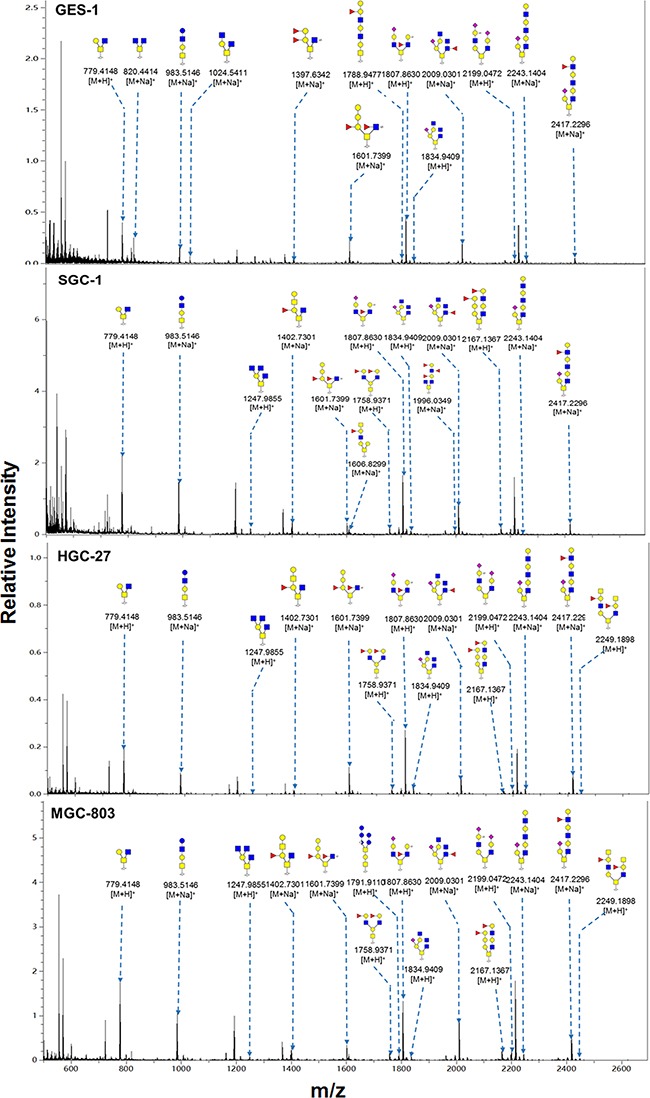
Figure 5. MALDI-TOF/TOF-MS spectra of total O-glycans in the four cell lines.

O-glycans were characterized in the four cell lines (GES-1, SGC-7901, HGC-27, and MGC-803 cells) by MALDI-TOF/TOF-MS as described in M&M. Representative spectra from triplicate experiments are shown. Detailed glycan structures were analyzed using the GlycoWorkbench program. Proposed structures and their m/z values are shown for each peak.
