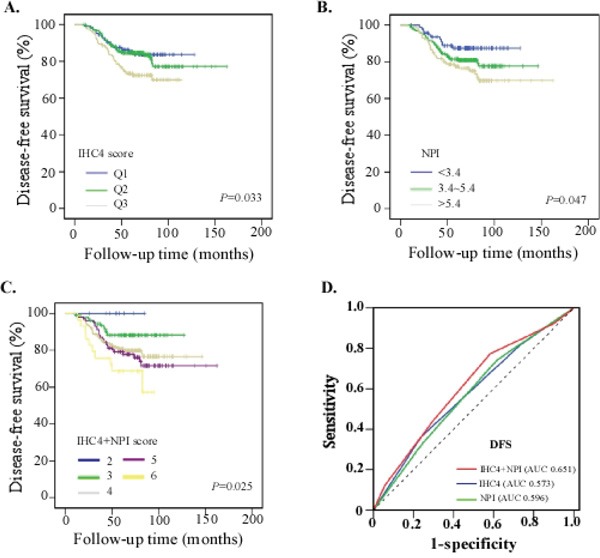
Figure 3. Survival analysis of predictors for the Study set.

A. Kaplan-Meier survival curves for patients with different IHC4 score; B. Kaplan-Meier survival curves for patients with NPI; C. Kaplan-Meier survival curves for patients with different NPI+IHC4 score; D. Comparison of the prognostic accuracy of NPI+IHC4 with IHC4 score and NPI alone in the Study set. We calculated p values using the log-rank test.
