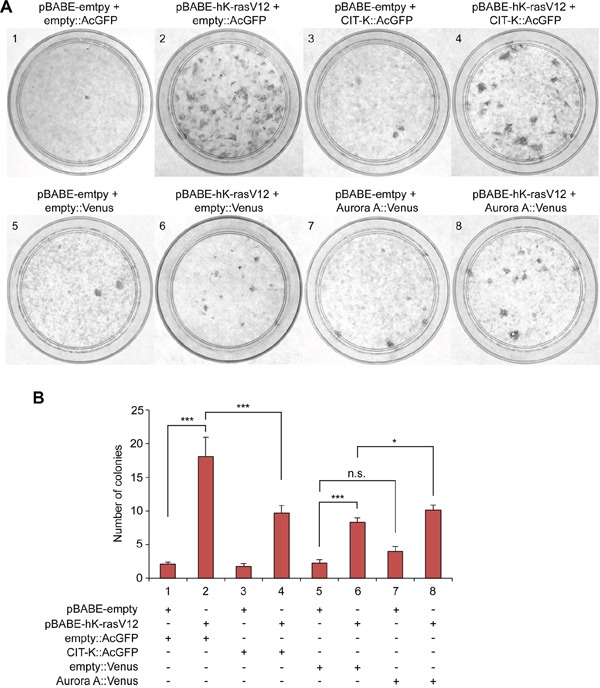
Figure 2. Over-expression of CIT-K does not increase colony formation.

A. NIH3T3 cells were transfected with AcGFP empty vector, CIT-K::AcGFP, Venus empty vector and Aurora A::Venus in combination with either pBABE empty vector or pBABE-hK-rasV12. Cells were cultured for 2 weeks, fixed, stained with crystal violet and colonies counted. Images displayed show black and white contrast of crystal violet stain. The numbers on the top left of each condition denote the transfection treatment as shown in B. B. Quantification of the colonies counted from A. For each condition n=4, the experiment was completed in triplicate (pooled data, n=12). *p < 0.05, ***p < 0.001 (Student's t-test), n.s., not significant, error bars represent standard error of the mean (SEM).
