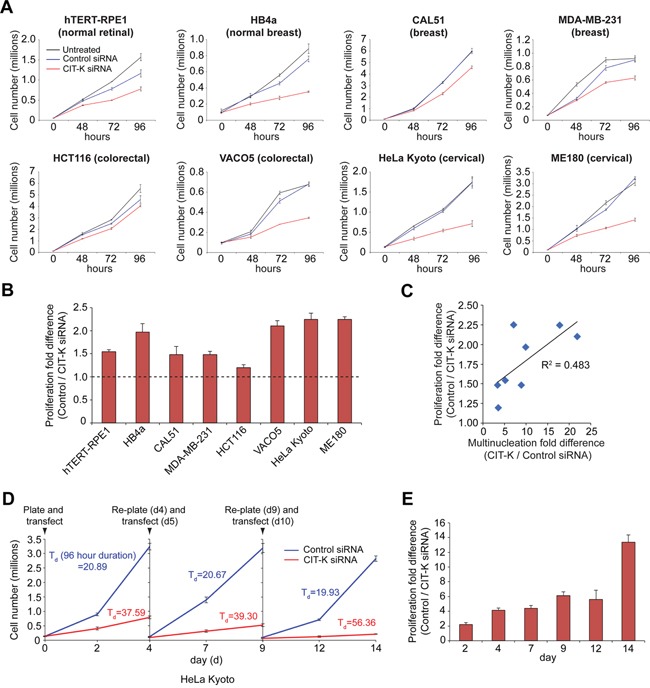
Figure 4. Depleting CIT-K decreases cell proliferation in cancer cells.

A. Cell lines were plated the day prior to transfection and were either untreated or treated with control or CIT-K siRNA at day 0 for up to 96 hours. Cell number was calculated at each time point and an aliquot of cells taken for Western blot analysis. Each condition was performed in triplicate, error bars represent SEM. B. Quantification of fold difference between control and CIT-K-siRNA treated cells at 96 h, n=3 (pooled data from A, n=9), error bars represent SEM. The dotted line represents a fold difference of 1 (being no difference in proliferation compared to control). Values above this line indicate a decrease in proliferation. C. Correlation analysis of multinucleation and proliferation fold differences. The values used for analysis can be found in Table 1. The Pearson correlation coefficient (R2) is listed next to the linear trend line. D. HeLa Kyoto cells were treated with either control or CIT-K siRNA for up to 96 h, where cells were counted, re-plated and transfected the subsequent day, for up to 14 days. At each time point an aliquot of cells was taken for Western blot analysis. The doubling time of cells (Td) was calculated over a 96 hour time period (day 0 to 4, day 5 to 9 and day 10 to 14) and listed next to the cell proliferation curve. Each condition was performed in triplicate, error bars represent SEM. E. Quantification of the experiment shown in D showing the proliferation fold difference between control and CIT-K siRNA-treated cells at each time point.
