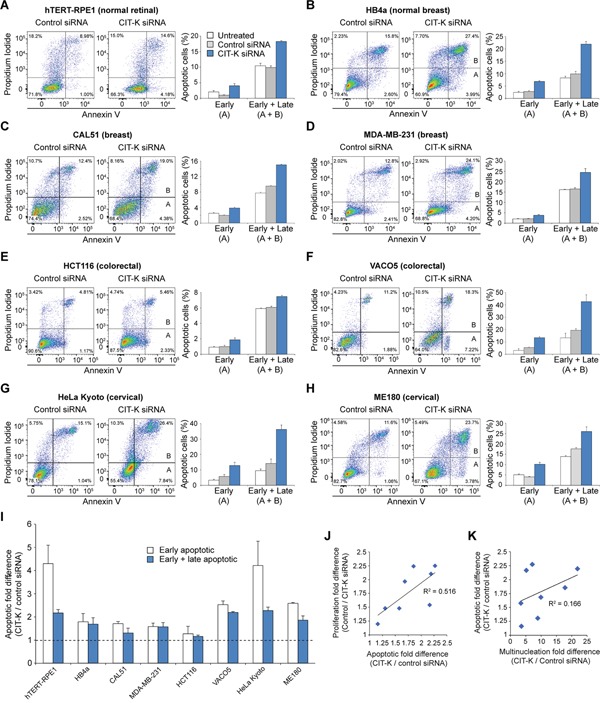
Figure 5. Cytokinesis failure induces apoptosis in cancer cells.

A-H. Cell lines were plated the day prior to transfection and were either untreated or treated with control or CIT-K siRNA for 72 h. Cells were harvested and stained with annexin V and propidium iodide (PI) to detect early apoptosis (annexin V positive, PI negative) and late apoptosis (annexin V positive, PI positive). Quantification of the flow cytometric data on the left is shown to the right, n=3. 20,000 cells were used in each analysis, error bars represent SEM. I. Quantification of fold difference between control and CIT-K-siRNA treated cells, n=3 (pooled data from A-H, n=9), error bars represent SEM. The dotted line represents a fold difference of 1; values above this line indicate an increase in apoptosis. J. Correlation analysis of proliferation and apoptotic fold differences. The values used for apoptotic fold difference is from the combined ‘Early + Late’ population. K. Correlation analysis of multinucleation and apoptotic fold differences. The Pearson correlation coefficients (R2) are listed next to the linear trend lines. The values used in J and K can be found in Table 1.
