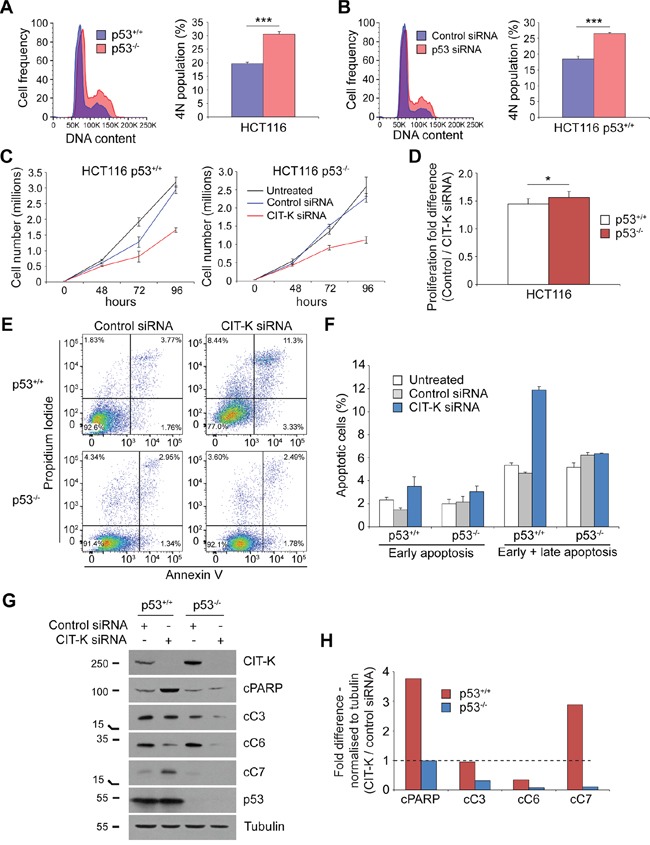
Figure 7. p53-dependent and independent pathways exist to initiate apoptosis following CIT-K depletion.

A. HCT116 p53+/+ and p53-/- cells were fixed in 70% ethanol and treated with PI/RNase solution to detect DNA content. 4N DNA content was analyzed by gating for the second, G2/M peak. 20,000 cells were used for each analysis, n=7, ***p < 0.001 (Student's t-test), error bars represent SEM. B. HCT116 p53+/+ cells were treated with either control or TP53 siRNA for 48 h, harvested, fixed in 70% ethanol and treated with PI/RNase solution to detect DNA content. 4N DNA content was analyzed by gating for the second, G2/M peak. 20,000 cells were used for each analysis, n=6, ***p < 0.001 (Student's t-test), error bars represent SEM. C. HCT116 p53+/+ and p53-/- cells were plated prior to transfection and were either untreated or treated with control or CIT-K siRNA at day 0 for up to 96 h. Cell number was calculated at each time point, each condition was performed in triplicate, error bars represent SEM. D. Quantification of fold difference between control and CIT-K-siRNA treated cells at 96 h, n=6 (pooled data from C, n=18), *p < 0.05 (Student's t-test), error bars represent SEM. E. HCT116 p53+/+ and p53-/- cells were treated with either control or CIT-K siRNA for 72 h, where cells were harvested and stained with annexin V and PI to detect apoptosis. 20,000 cells were used in each analysis. F. Quantification of the flow cytometric data shown in E. Errors bars represent SEM, n=3. G. HCT116 p53+/+ and p53-/- cells were treated with either control or CIT-K siRNA for 48 h, harvested and protein extracts analyzed by Western blot to detect CIT-K, cleaved PARP, cleaved caspases 3, 6 and 7, p53 and tubulin. The numbers on the left indicate the sizes in kilodaltons of the molecular mass marker. H. Band intensities of the Western blot analysis from G was analyzed by ImageJ, normalized to tubulin, and the fold difference between CIT-K and control siRNA lysates calculated. The dotted line represents a fold difference of 1; values above this line indicate an increase of protein cleavage and thus activation.
