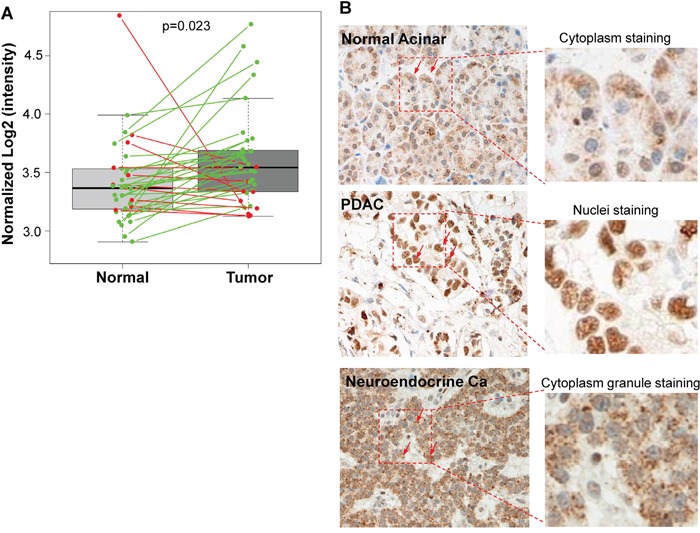
Figure 1. Sema3E is overexpressed in human pancreatic adenocarcinoma (PDAC).

A. Paired analysis of Sema3E gene expression in the GEO PDAC microarray dataset GDS4103 (n=72) shows a significant increase in Sema3E gene expression in tumors compared to matched normal tissue controls (Student's t-test, p=0.02). The green lines indicate paired samples with upregulated Sema3E expression, while red lines indicate paired samples with downregulated Sema3E expression. B. Representative IHC staining for Sema3E in human tissues: acinar cells of normal pancreas (left panel), pancreatic adenocarcinoma (PDAC) (middle panel), and pancreatic neuroendocrine carcinoma (right panel). Arrows point to the location of Sema3E staining in brown in each of these tissues: mostly cytoplasmic in normal acinar cells, mostly nuclear in PDAC, and in cytoplasmic granules in neuroendocrine carcinoma. Red squares are small sections that got further magnified to shown clear cellular localization of Sema3E staining.
