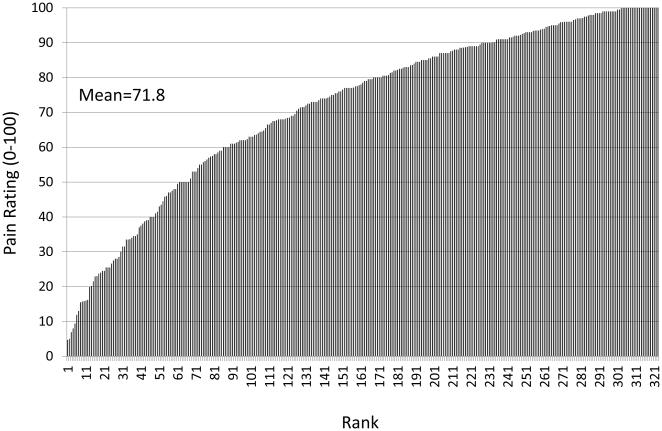
Figure 1.
Pain ratings in response to a heat stimulus (48 deg C) by 321 healthy young adults. Each line represents the pain rating (from 0 [no pain] to 100 [most intense pain imaginable]) by a single person. As can be seen, the mean pain rating was 71.8, but ratings ranged from 4 to 100. These data illustrate dramatic inter-individual differences in responses to a standardized experimental pain stimulus.

