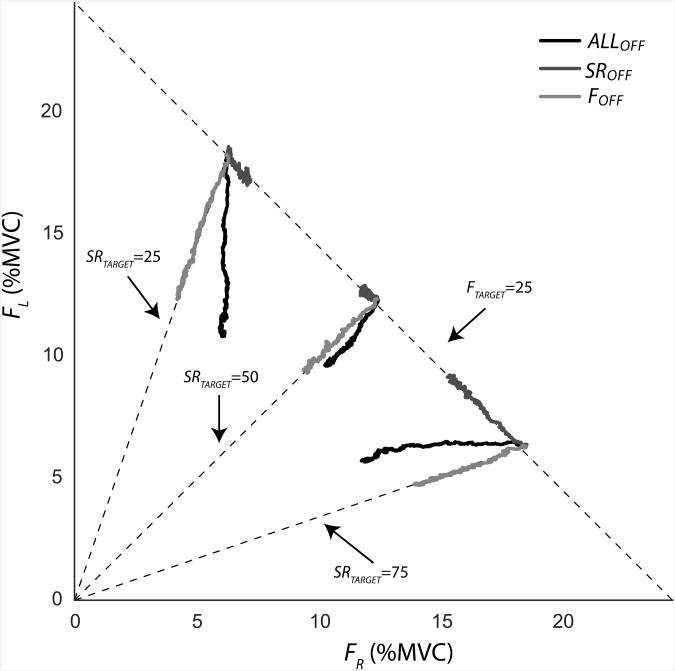
Figure 4.
The total force (FTOT, dashed line with negative slope) and sharing ratio (SR, dashed lines with positive slopes) represented in the finger force space (FL and FR, left and right finger forces, respectively). The solid traces represent data averaged across subjects for the three sharing ratio targets (SRTARGET: 25%, 50%, and 75%) and three visual feedback conditions: On FTOT only (SROFF); on SR only (FOFF); and on neither FTOT nor SR (ALLOFF). No error shades are shown to prevent cluttering of the plot. Note that FTOT consistently drifted toward lower values, while the direction of SR drift depended on the initial SR value.

