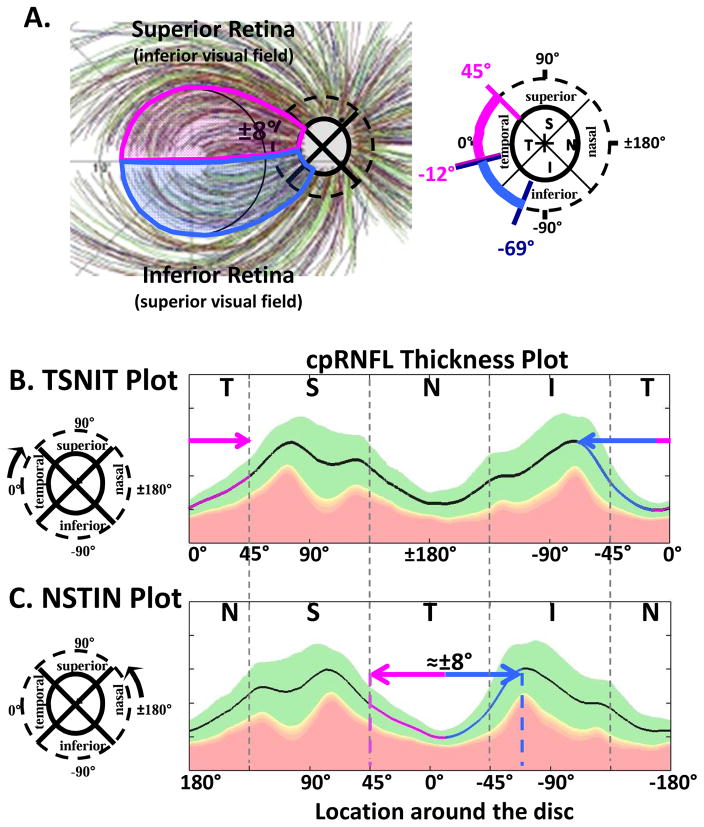
Fig. 1.
A schematic model of the macula relating retinal ganglion cell (RGCs) axons locations to circumpapillary retinal nerve fiber (cpRNFL) locations. (A) The borders of the superior (magenta) and inferior (light blue) regions of the macula supplying RNF input to the disc are superimposed on RNFL tracings modified from Fig. 2A in Jansonius et al. (2012), with permission. (B) The cpRNFL thickness plot is shown in the typical temporal (N) to superior (S) to nasal (N) to inferior (I) to temporal (N) orientation. The regions of the cpRNFL associated with macula (±8°) are shown by the magenta and light blue horizontal lines and arrows. (C) Same as (B) but with the cpRNFL thickness plot shown in the NSTIN orientation.

