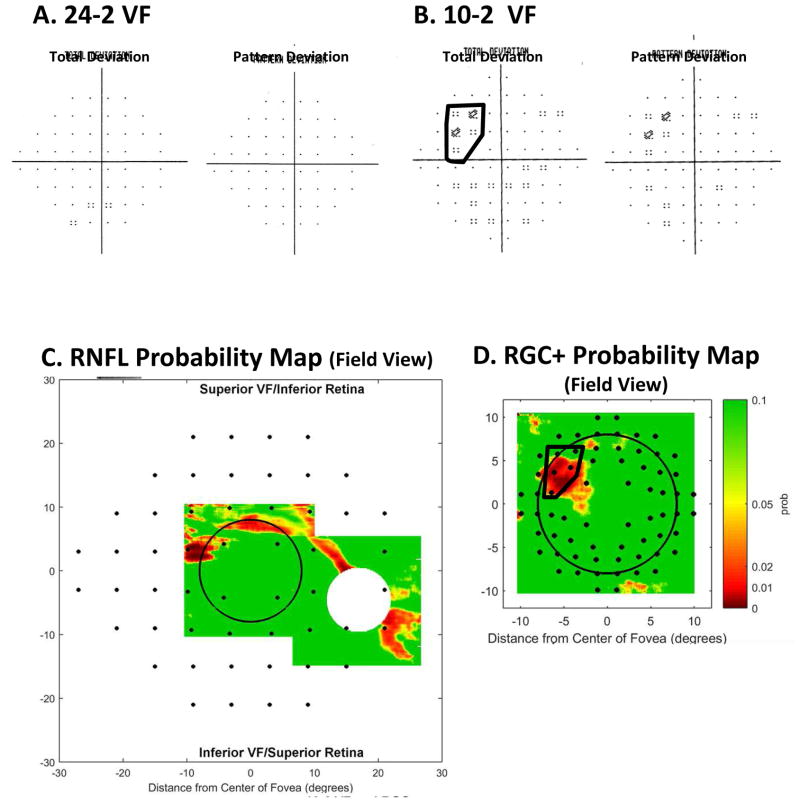
Fig. 14.
A comparison of abnormal regions on the VFs and OCT RNFL and RGC+ probability maps for the eye in Fig. 9. (A) 24-2 VF probability maps. (B) 10-2 VF probability maps with an abnormal region enclosed within the black border. (C) The RNFL probability map from Fig. 9E flipped to be in field view and with the 24-2 VF locations from Fig. 13A superimposed. (D) The RGC+ probability map from Fig. 9F flipped to be in field view with the 10-2 VF locations from Fig. 13B superimposed. The 10-2 points within the black border are the same as in panel (B).

