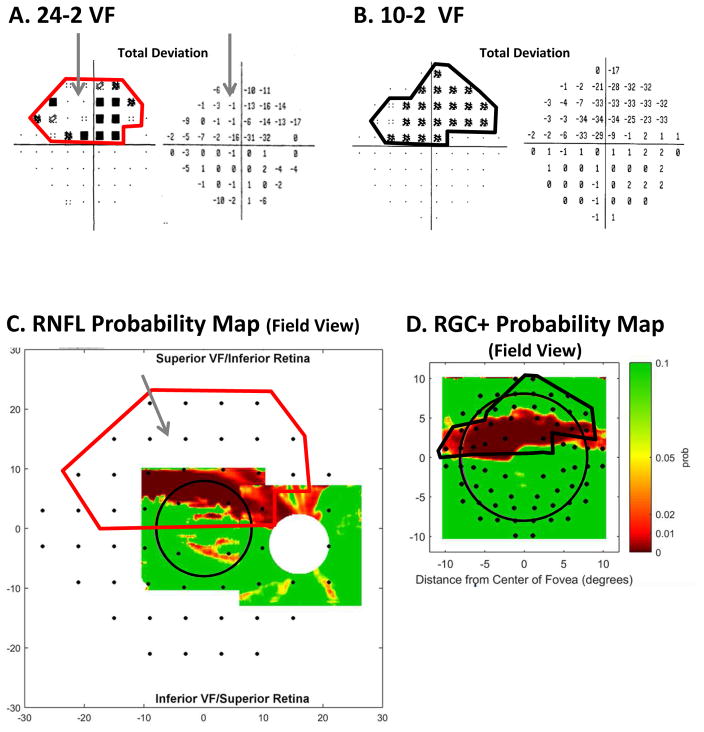
Fig. 15.
A comparison of abnormal regions on the VFs and OCT RNFL and RGC+ probability maps for the eye in Fig. 19. (A) 24-2 VF total deviation (TD) probability map (left) and TD values (right) with an abnormal region enclosed within the red border. The gray arrow indicates an area of the VF with relatively good TD values. (B) 10-2 VF total deviation (TD) probability map (left) and TD values (right) with an abnormal region enclosed within the black border. (C) The RNFL probability map from Fig. 10E flipped to be in field view and with the 24-2 VF locations from Fig. 13A superimposed. The 24-2 points within the red border are the same as in panel (B). (D) The RGC+ probability map from Fig. 10F flipped to be in field view with the 10-2 VF locations from Fig. 13B superimposed. The 10-2 points within the black border are the same as in panel (B).

