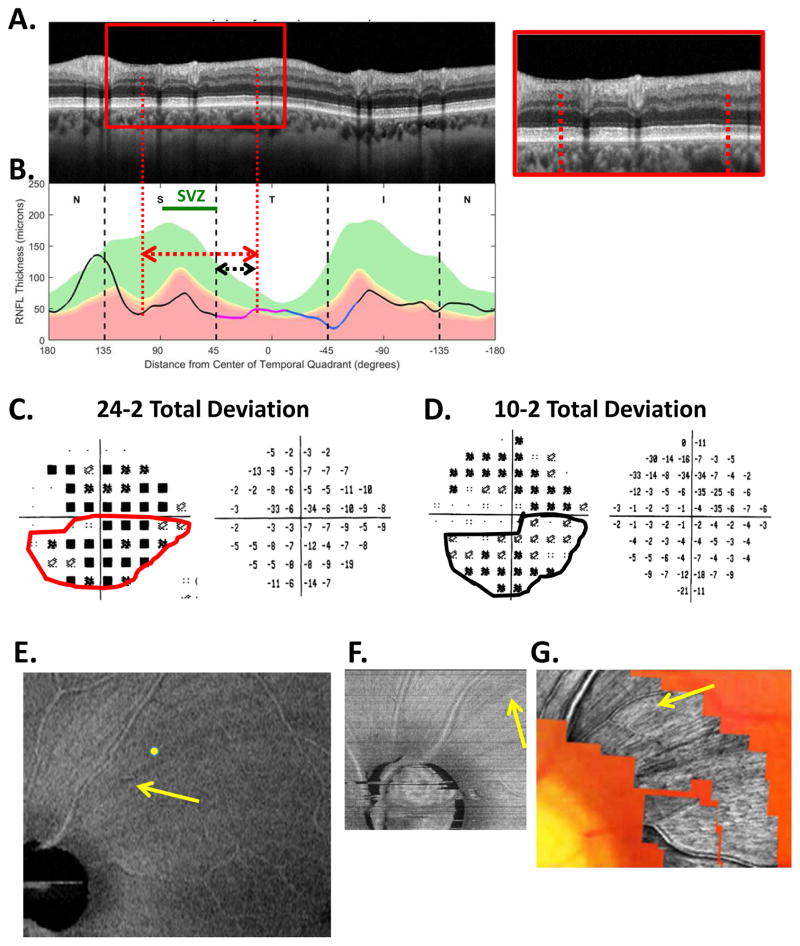
Fig. 19.
The sdOCT results for an eye with widespread cpRNFL damage. (A) An image from a circumpapillary scan. (B) The cpRNFL thickness plot (black, magenta, and light blue curve). The SVZ is shown as the green line. (C) The 24-2 VF total deviation (TD) probability map (left) and TD values (right) with the inferior abnormal region enclosed within the red border. (D)) The 10-2 VF total deviation (TD) probability map (left) and TD values (right) with the inferior abnormal region enclosed within the black border. The corresponding regions of the cpRNFL are indicated by the red and black lines with arrows in panels A and B. (E) An en-face slab image of the 9×12mm scan. (F) An en-face slab image of a 3×3mm scan of disc. (G) AO-SLO image. The yellow and white arrows are approximately the same locations in panels (E), (F), and (G). Modified from Fig. 6A, B in Hood et al. (2015B).

