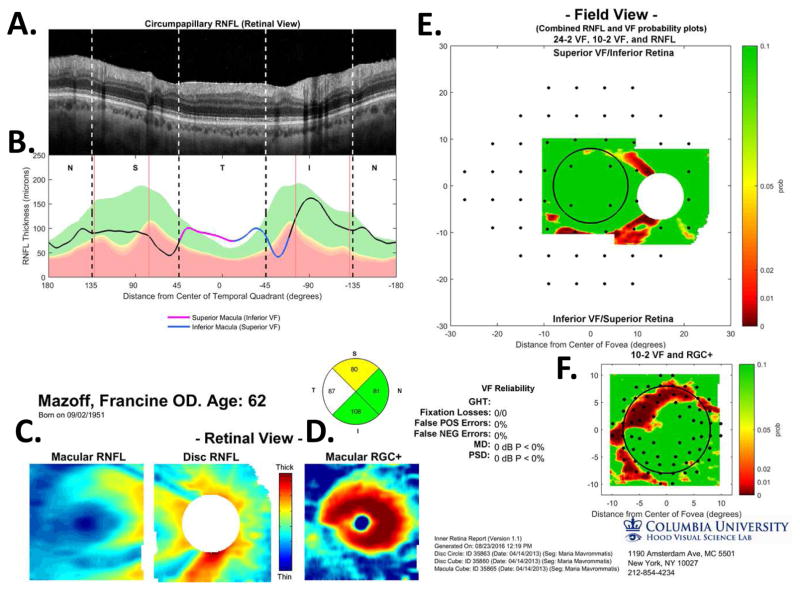
Fig. 20.
A one-page OCT report for the eye in Fig. 5. (A) An image from a circumpapillary scan. (B) The cpRNFL thickness plot (black) obtained from the disc cube scan (solid) in panel (C, left panel) and the circle scan (dashed) in panel (A) and shown in NSTIN orientation as in Fig. 1C. (C) The RNFL thickness map from the sdOCT cube scan of the macula (left) and disc (right). (D) The RGC+ thickness map from the sdOCT cube scan of the macula. (E) The RNFL probability maps based upon the thickness maps in panel (C) shown in VF view with the 24-2 VF locations from Fig. 13A superimposed. (F) The RGC+ probability map based upon the thickness maps in panel (D) with the 10-2 VF locations from Fig. 13B superimposed. The black circles in panels (E) and (F) show the borders (±8°) of the macula and, the color bar to the right shows the probability for both the OCT thickness. Designed by Hood and Raza (2014).

