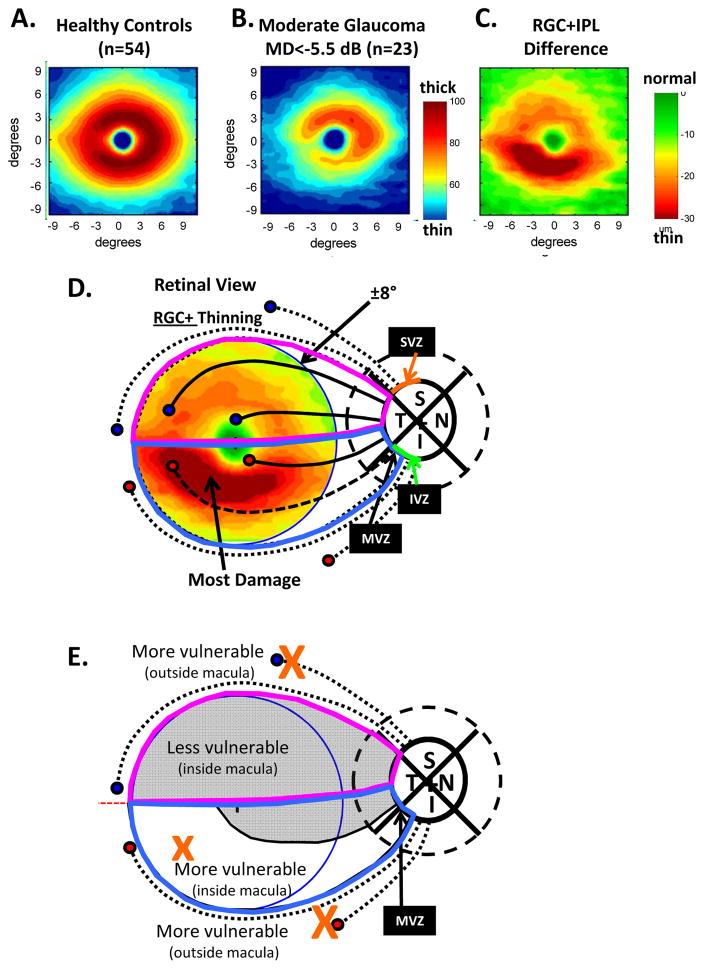
Fig. 4.
Retinal ganglion cell plus inner plexiform thickness (RGC+) and glaucomatous damage seen with spectral domain (sd) OCT. (A) The average RGC+ thickness map for 54 healthy controls shown in pseudo-color. (B) The average RGC+ thickness map for 23 patients with moderate glaucoma [i.e., 24-2 visual field mean deviation (MD) worse than −5.5 dB] shown in pseudo-color. (C) A difference map generated by subtracting the RGC+ thickness map for the age-similar controls in panel (A) from the RGC+ thickness map in panel (C). The color indicates the degree of thinning. (D) The schematic model of the macula from Figs. 1 and 3 is superimposed upon the central ±8° of panel C to indicate the relationship of the thinned region in panel C to the region projecting to the MVZ. The circles represent groups of RGCs and the associated black lines bundles of axons. The axon bundles with solid black lines feed into the temporal quadrant, while those with the interrupted black lines project to the SVZ (upper dotted), the MVZ of the IVZ (dashed) and IVZ outside the MVZ (lower dotted). (E) The regions from panel D are shown with the more and less vulnerable regions labelled. Panels A, B and C are modified from (Hood et al., 2012).

