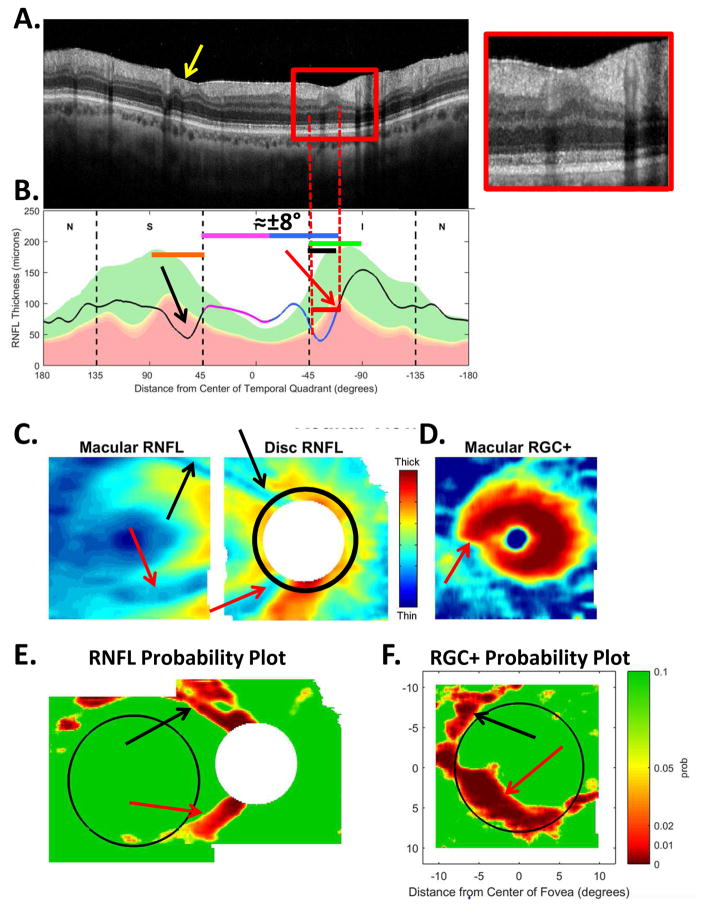
Fig. 5.
The sdOCT results for an eye with a relatively local, but relatively deep cpRNFL defect. (A) An image from a circumpapillary scan along with the region within the red rectangle showed enlarged to the right. The white arrows point to the defect. (B) The cpRNFL thickness plot (black, magenta, and light blue curve) obtained from the disc cube scan (solid) in panel (C, left panel) and the circle scan (dashed) in panel (A) and shown in NSTIN orientation as in Fig. 1C. (C) The RNFL thickness map from the sdOCT cube scan of the macula (left) and disc (right). (D) The RGC+ thickness map from the sdOCT cube scan of the macula. (E) The RNFL probability maps based upon the thickness maps in panel (C). (F) The RGC+ probability map based upon the thickness maps in panel (D). The black circles in panels (E) and (F) show the borders (±8°) of the macula. The arrows in all panels show the abnormal regions associated with the superior (black) and inferior (red) defects.

