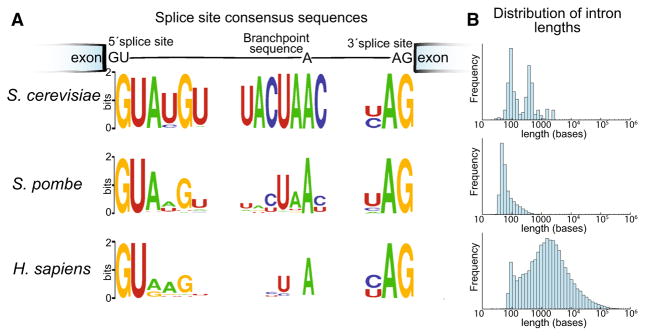
Fig. 1.
Comparison of intron features in yeasts and humans. a Sequence logos depict the consensus sequence of splice site sequences. The total height at each position is proportional to the conservation at that position (Crooks et al. 2004). b The distribution of intron lengths for each species is shown as a histogram. Intron lengths and splice site sequences were obtained from (Kent et al. 2002; Wilhelm et al. 2008). Branch point sequences were obtained from (Clark et al. 2002; Gao et al. 2008; Stepankiw et al. 2015)

