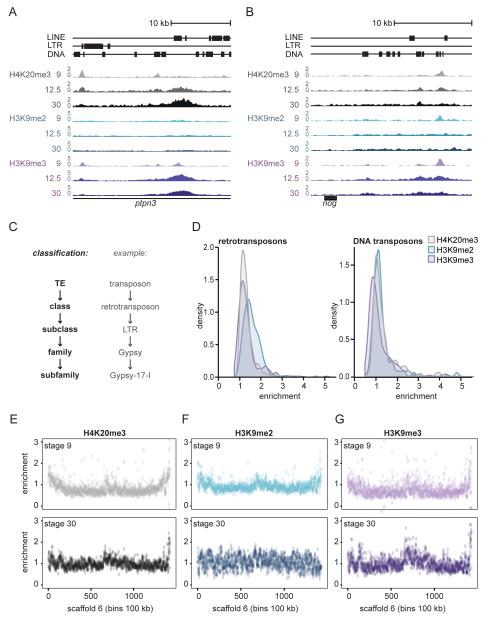
Fig. 1. A subset of transposons acquires H4K20me3, H3K9me2 or H3K9me3.
A, B) Genome browser views of the first intron of ptpn3 (panel A) and downstream of nog (panel B), showing H4K20me3 (grey), H3K9me2 (blue) and H3K9me3 (purple) signal (RPKM) at TEs in developmental stages 9, 12.5 and 30 (top to bottom). C) TEs can be classified in DNA and retrotransposons, with subclasses, families and subfamilies. D) Distribution of histone modification enrichment at retrotransposon (left) and DNA transposon (right) subfamilies. Median H4K20me3, H3K9me2 and H3K9me3 enrichment over input was calculated for all TE subfamilies. For each subfamily we used the stage (9, 10.5, 12.5, 16 or 30) with maximal enrichment. E, F, G) Chromosome scale enrichment of histone modifications at Scaffold 6. Histone modification RPKM enrichment over input DNA of E) H4K20me3, F) H3K9me2 and G) H3K9me3 was calculated in bins of 100kb. Top: stage 9. Bottom: stage 30.

