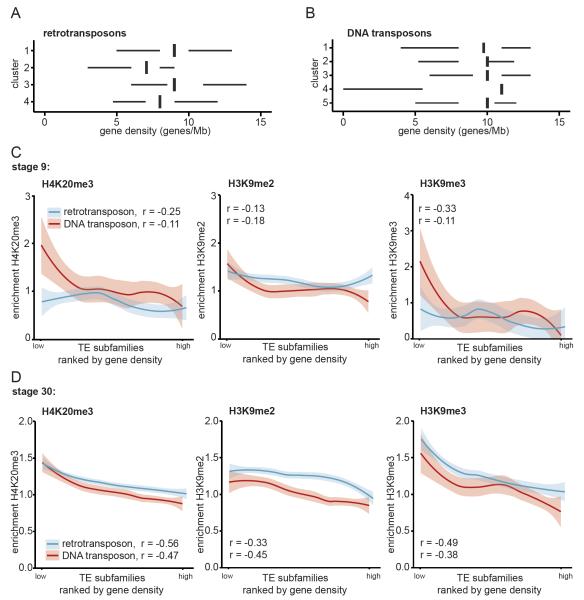
Fig. 3. Strongest enrichment for H4K20me3 and H3K9me3 at transposons in gene desert.
For each TE subfamily the median gene density was calculated 500.000 bp up- and downstream of the center of each TE. A) Retro- and B) DNA transposon subfamilies were grouped according to clusters determined in Fig. 2A, B. Median gene densities for the subfamilies were plotted for each cluster. The left and right hinges correspond to the 25th and 75th percentiles and the vertical line in between represents the median. C, D) All TE subfamilies were ranked by gene density and median H4K20me3 (left), H3K9me2 (middle) and H3K9me3 (right) enrichments during stage C) 9 and D) 30 were plotted for retro- (blue) and DNA transposon (red) subfamilies. Loess was used as smoothing method, with a 0.95 confidence interval. Spearman correlation between histone mark and gene density was determined (left corner).

