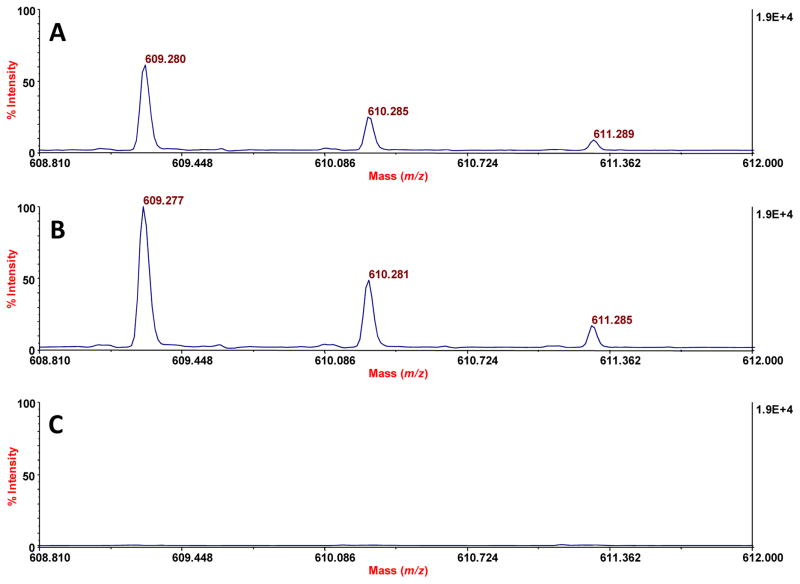
Figure 11.
MALDI-TOF-MS spectra similar to that of Figure 10, except here the data for recovery of reserpine is shown. Assignment of peaks: 609.280, protonated reserpine; 610.285 and 611.289, isotopic peaks for protonated reserpine. A. Spectrum from a urine that was spiked with 400 nmol of reserpine. B. Similar spectrum where a second spike (140 fmol) was done just prior to MALDI-TOF-MS analysis. C. Spectrum from a blank urine, lacking peaks for protonated reserpine.

