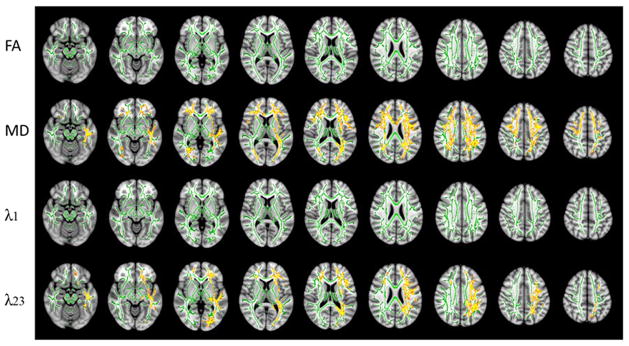
Fig. 2.
DTI results from an FSL-TBSS analysis showing possible alterations in DTI metrics including FA, MD, λ1 and λ23 between the sleepy and the non-sleepy groups. Green: mean FA skeleton (threshold = 0.2) without significant change. Red-yellow: fibers with increased DTI metrics in the sleepy group when compared to the non-sleepy group (p < 0.05).

