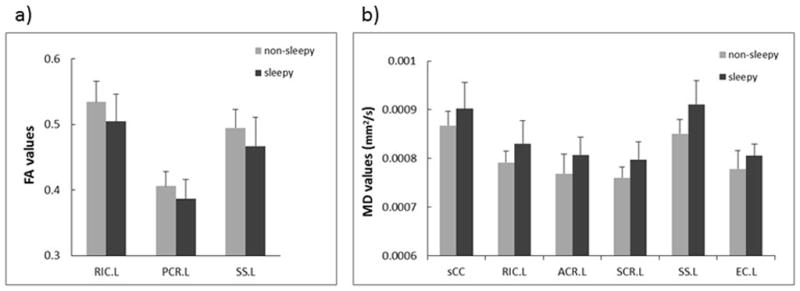
Fig. 3.

Difference (p < 0.05, FDR corrected) in mean FA (a) and MD (b) in selected WM fiber tracts between the sleepy and non-sleepy groups. MD is expressed in units of mm2/s. “L” denotes left hemisphere. The abbreviations for the individual fiber tracts are defined in the caption of Fig. 1.
