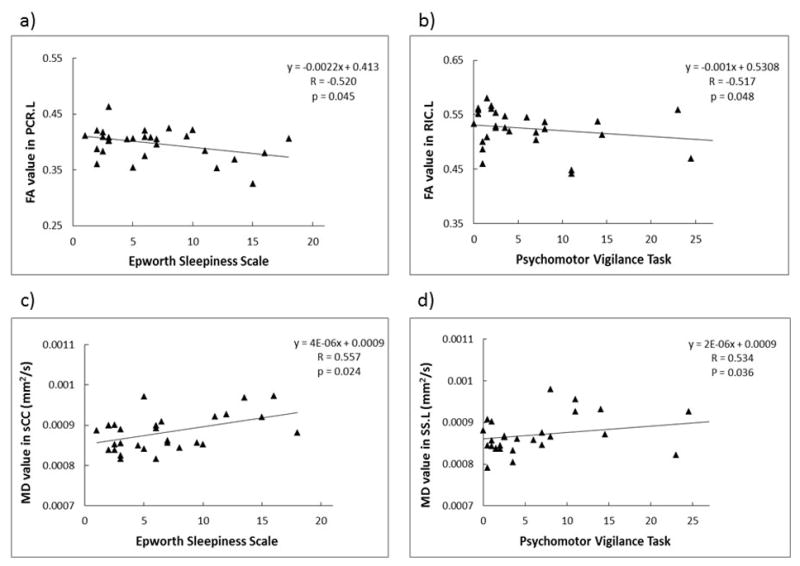
Fig. 4.

Correlation between the FA (a and b) or MD (c and d) values of the specific fiber tracts and the Epworth Sleepiness Scale (ESS; a and c) or the Psychomotor Vigilance Task (PVT; b and d) score. The linear regression results are indicated in the figure (R: Pearson correlation coefficient with BMI and age as covariates). MD is expressed in units of mm2/s. The abbreviations for the individual fiber tracts are defined in the caption of Fig. 1.
