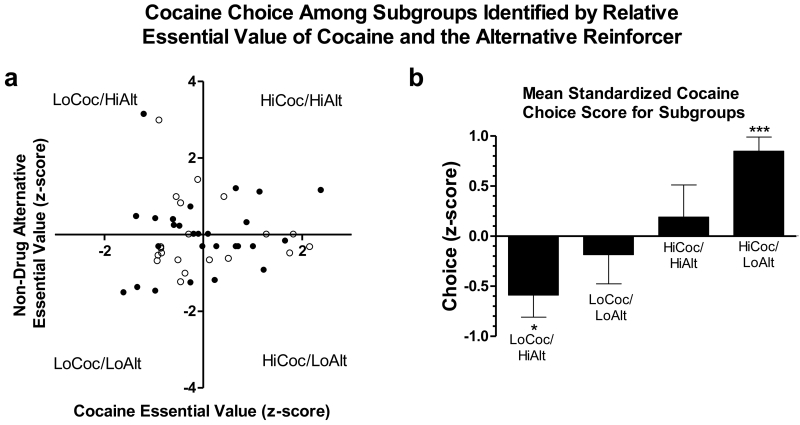
Figure 6.
Data from the analysis combining rats from Exp.s 1 and 2. (a) Scatterplot of individual subjects’ standardized essential values of cocaine and the non-drug alternative. Filled circles indicate rats from Exp. 1, open circles indicate rats from Exp. 2. Rats were classed into subgroups based on which quadrant of the scatterplot they were in (“HiCoc” = high cocaine essential value, “LoCoc” = low cocaine essential value, “HiAlt” = high alternative essential value, “LoAlt” = low alternative essential value). (b) Mean (± SEM) standardized cocaine choice score for these subgroups. *** and * indicate p < 0.001 and p < 0.05, respectively.

