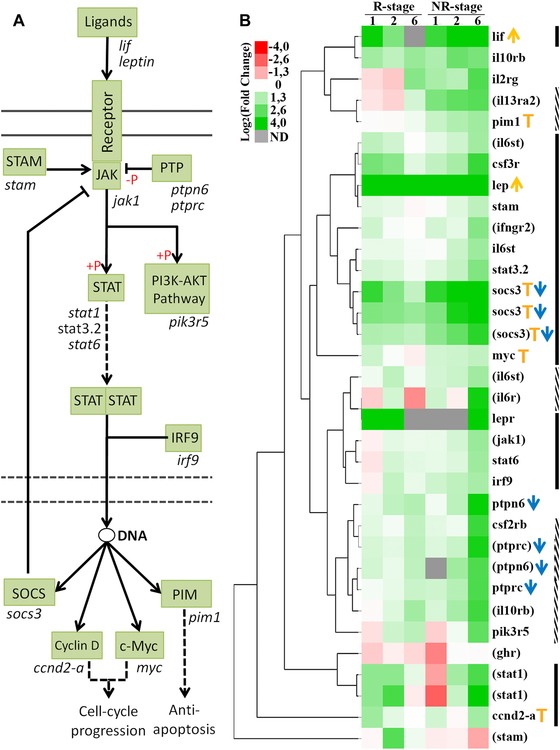
Figure 1.

Differential regulation of components of the JAK‐STAT pathway in response to SCI in the R and NR stages. (A) Diagram of the JAK‐STAT signaling pathway based on the KEGG database. Components of the pathway are shown in green boxes and, with the exception of receptors, genes with differential expression between the R and NR stages are shown below the boxes. Following the binding of ligands to their respective receptors, STAT proteins are phosphorylated (+P red symbol) and activated by JAK tyrosine kinases. Once activated, STAT proteins dimerize and translocate to the nucleus to modulate gene expression. (B) Heat map of genes related to the JAK‐STAT pathway with differential expression between the R and NR stages. Columns indicate the expression of the R and NR stage at 1, 2, and 6 dpt; grey boxes indicate not detected (ND) transcripts. Orange arrows indicate ligands, blue arrows indicate pathway suppressors and orange T indicate pathway targets. Black lines indicate genes with an early upregulation on R stage (1 and/or 2 dpt) and a sustained or late upregulation on NR stage up to 6 dpt. Dotted lines indicate genes that are only upregulated at 6 dpt on NR stage. According to the Lee‐Liu et al. (2014) data, black and dotted lines consider only statistically significant values and genes identified by Blast2GO are shown in parentheses.
