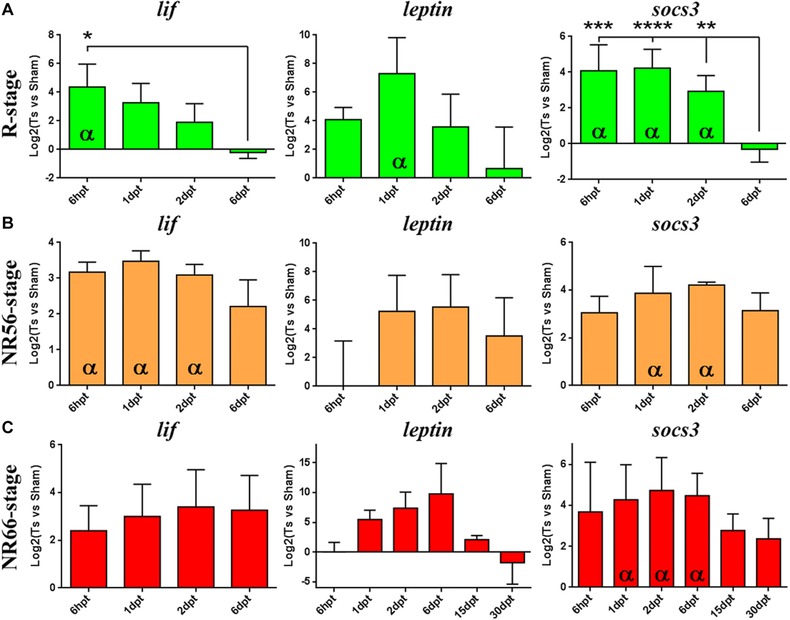
Figure 2.

RT‐qPCR analysis of the levels of JAK‐STAT pathway components in response to SCI. Expression analyses by RT‐qPCR of genes related to the JAK‐STAT pathway are shown in response to SCI for (A) R stage (green), (B) NR56 stage (orange) and (C) NR66 stage (red). At least three biological replicates prepared from different animal pools were analyzed from 6 hpt to 6 dpt or 30 dpt for each stage. Relative expression was normalized to eef1a‐1 expression and to sham operated animals. Two statistical tests were assessed: (i) t‐test with 95% confidence was performed to determine a significant difference (α symbol) from sham levels (log2(transected vs sham) = 0) and (ii) the difference between time points was assessed by multiple comparisons with a one‐way ANOVA test (****P < 0.0001; ***P < 0.001; **P < 0.01; *P < 0.05).
