Figure 4.

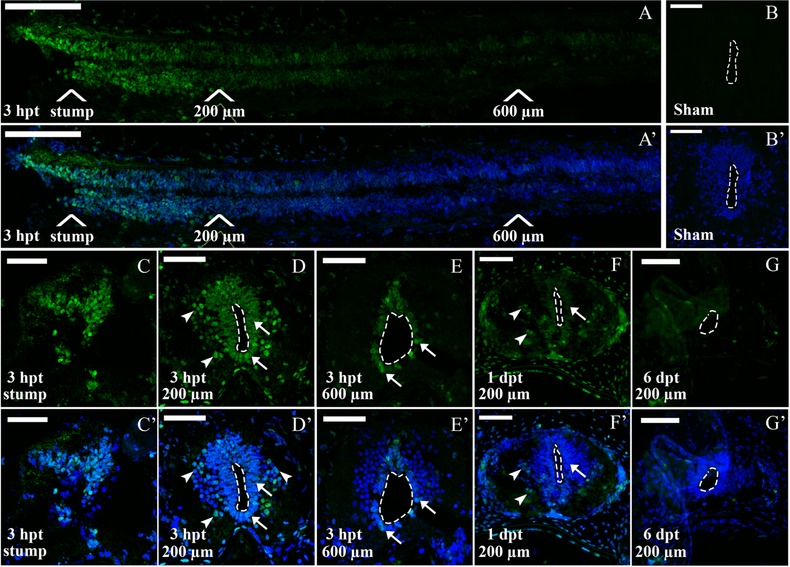
Immunofluorescence analysis of p‐STAT3 in R stage animals after SCI. Sections through the spinal cord of regenerative animals analyzed for pSTAT3 (green) and TOTO3 (nuclei, blue). (A), (A′) Sagittal section through the caudal portion of a spinal cord at 3 hpt. White arrows show positions for the stump and 200−600 μm caudal to the lesion site. (B), (B′) Coronal section from an uninjured spinal cord. (C)−(E′) Coronal sections from a transected animal at 3 hpt at (C), (C′) the stump level and (D), (D′) 200 and (E), (E′) 600 μm caudal to the lesion site. Arrows indicate representative pSTAT3+ cells in the ventricular zone (white arrows) and in the grey matter (white arrowheads). (F), (F′) Coronal sections at 1 dpt at 200 μm caudal to the injury site. (G), (G′) Coronal section at 6 dpt at 200 μm caudal to the injury site. Dotted lines delimit the central canal. White bars indicate 100 μm (A), (A′) and 50 μm (B)−(G′). The sections depicted are representative of three animals per time point.
