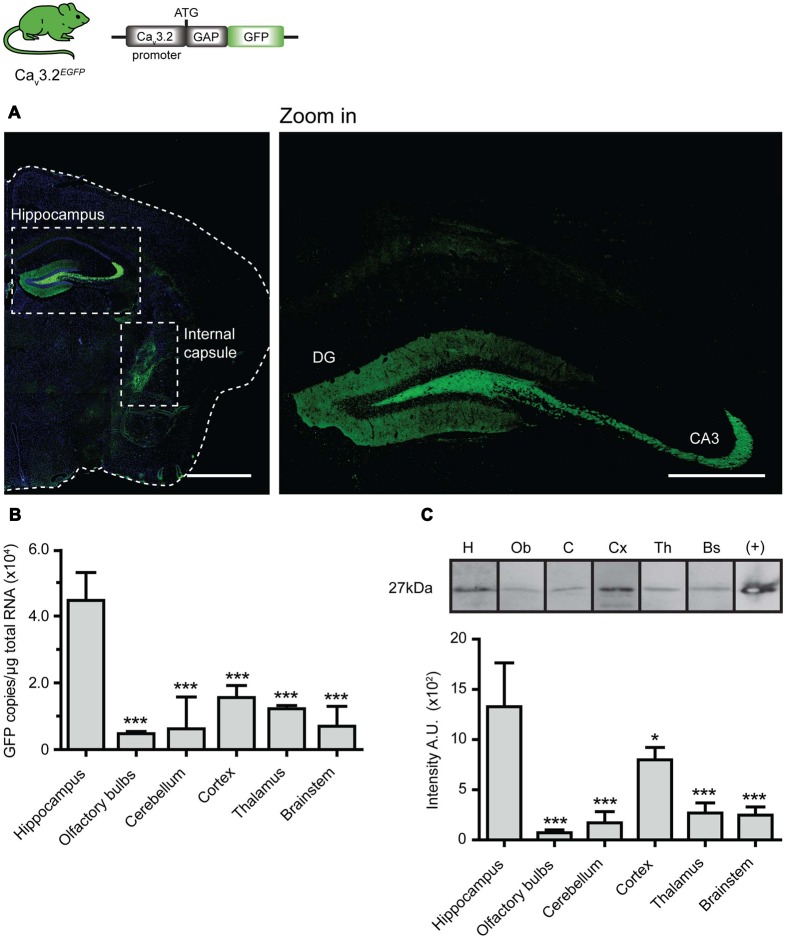
FIGURE 1.
EGFP expression pattern in brain of Cav3.2EGFP knock-in mice. (A) EGFP immunostaining of brain coronal sections of Cav3.2GFP mouse. Positive staining is observed only in axons of the hippocampus (also see zoom in) and in the internal capsule. Scale bar: 1 mm; scale bar in the zoom in panel: 500 μm. (B) Quantification of GFP mRNA in different regions of the brain by qPCR. The amount of EGFP molecules per μg of total RNA used for reverse transcription was calculated using a standard curve constructed with consecutive dilutions of the pEGFP-N3 plasmid (Ct vs. log[EGFP]). The amount of EGFP molecules in the hippocampus was compared to those from other regions in the brain. ∗∗∗P ≤ 0.001, n = 3, Dunnet’s multiple comparison test. Data presented as mean + SD. (C) Lower panel shows representative Western blots of different brain regions with the GFP protein band at 27 kDa. Note that bands were imaged from the same Western blot but the lane order was changed for presentation purposes. Protein extract from HEK cells transfected with pEGFP-N3 was used as a positive control. The bar graph illustrates the densitometry quantification of EGFP in brain. Arbitrary units (AUs) from the hippocampus were compared to those from the other regions of the brain. ∗P ≤ 0.05; ∗∗∗P ≤ 0.001, n = 3, Dunnet’s multiple comparison test. Data presented as mean ± SD.

