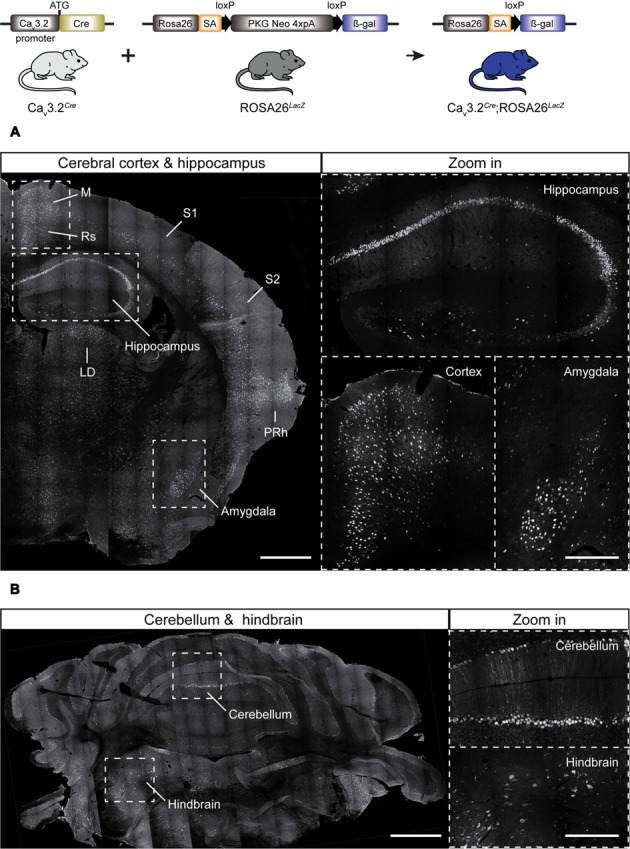
FIGURE 2.

Cre activation in the brain of Cav3.2Cre; Rosa26LacZ mice. (A) Coronal section of Cav3.2Cre;Rosa26LacZ adult mouse brain stained using antibody against β-gal. Dashed lines indicate brain regions that are shown as a zoom in: hippocampus, cortex, and amygdala. In these regions, dense and intense βgal signal was observed. (B) Coronal sections of cerebellum and hindbrain. Notice that not every single Purkinje cell of the cerebellum was positive (zoom in). Positive staining for β-gal in some cells of the hindbrain are shown in a zoom in. Scale bars: 600 μm; scale bars in the zoom in panels: 300 μm. M, motor cortex; Rs, retrosplenial cortex; S1, primary somatosensory cortex; S2, secondary somatosensory cortex; LD, laterodorsal thalamic nucleus; PRh, perirhinal cortex.
