Figure 4.
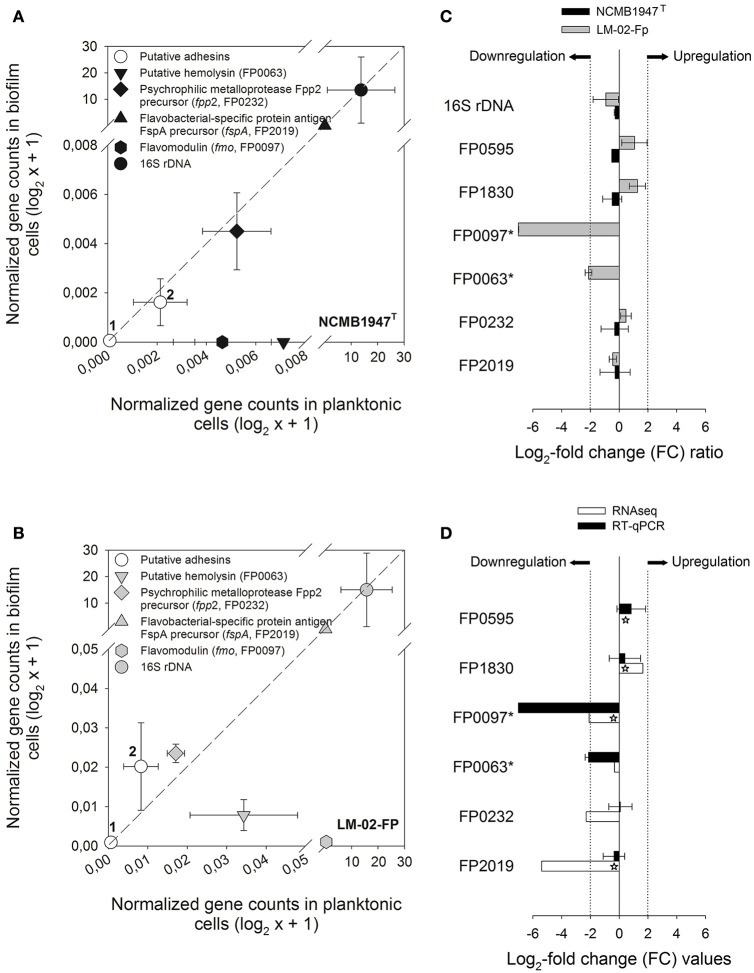
Expression analysis of specific genes in biofilm and planktonic states. RT-qPCR data from 4-day-old biofilms were compared against their respective planktonic counterparts for the (A) NCMB1947T and (B) LM-02-Fp strains. Symbols represent averages from three independent experiments. Open circles indicate putative adhesins encoded by the FP0595 and FP1830 genes (1 and 2, respectively). The diagonal dashed lines indicate a perfectly linear relationship (1:1 ratio) between biofilm and planktonic RT-qPCR data. (C) Fold change (FC) ratios for specific genes computed from biofilm and planktonic RT-qPCR data. A FC value was not computable for asterisk-labeled genes in the NCMB1947T strain as these were only detected in the planktonic state. (D) RT-qPCR- vs. RNA-Seq-based FC for specific genes in black and white bars, respectively. Significant FC values derived from RNA-Seq data are indicated by stars on white bars (Padj-value ≤ 0.001). Log2-FC values ≥ 2 and ≤ −2 in (C,D) indicate upregulated and downregulated genes in the biofilm state, respectively.

