
FIGURE 2.
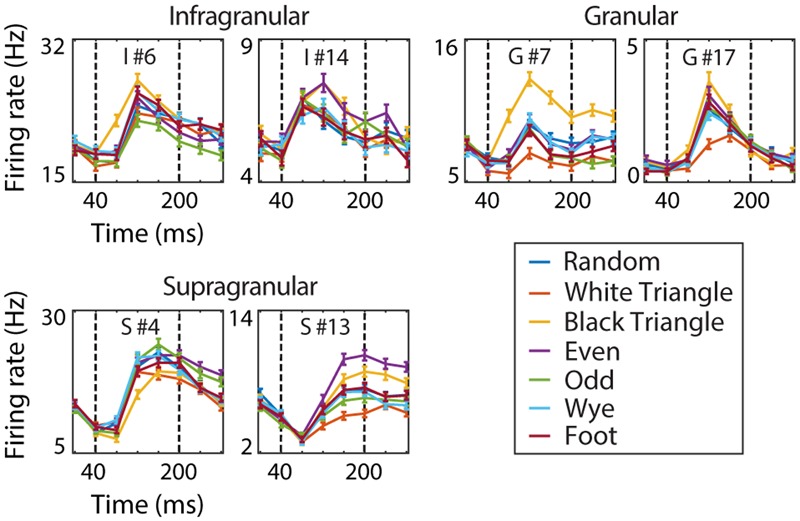
V2 example cells. The dynamic response of six V2 example cells to the MSCT textures (mean over 1024 examples and two repeats, error bars reflect the standard error). Dotted vertical lines indicate the time window used for analysis. This figure shows that V2 MSCT selectivity was diverse and that the time course of the neural response contained both transient and sustained components.