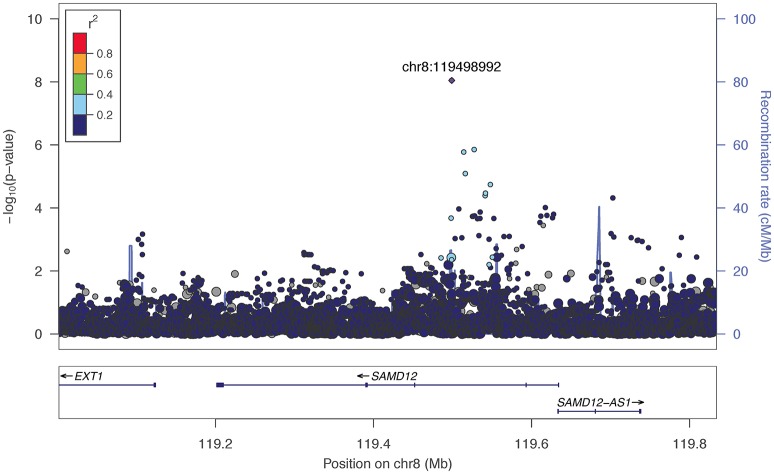
Figure 2.
Regional association plot for SAMD12 and 200 kb flanking regions. The most significant marker is in purple (rs73317305, p = 9.02 × 10⁻⁹, q = 0.11 for Problems). Linkage disequilibrium information is based on the 1000 Genomes AFR super-population, as the minor allele was rare in other subgroups. The size of the points representing plotted SNPs corresponds to the meta-analysis sample size.

