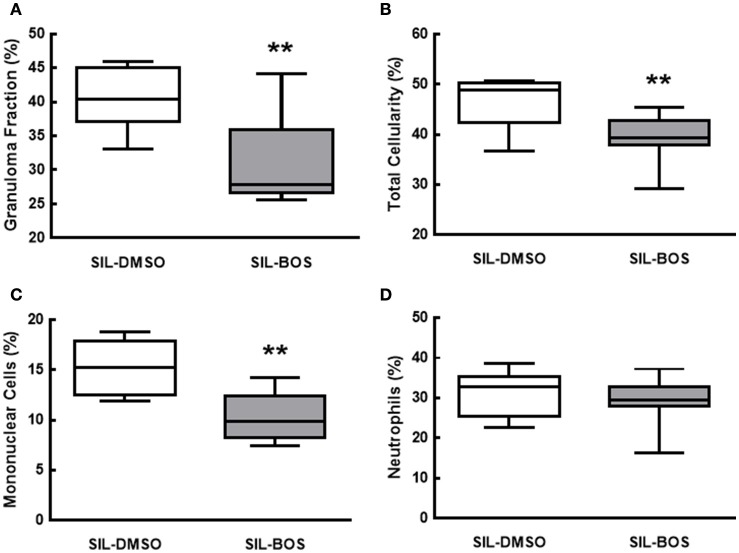
Figure 4.
Fraction area of granuloma in lung parenchyma (A) and percent total cell count (B), mononuclear cells (C), and neutrophils (D). All values were computed in 10 random, non-coincident fields of views per mouse. Boxes show the interquartile (25–75%) range, whiskers encompass the range (minimum–maximum), and horizontal lines represent median values of 8 animals per group. **Significantly different from SIL-DMSO (p < 0.05).

