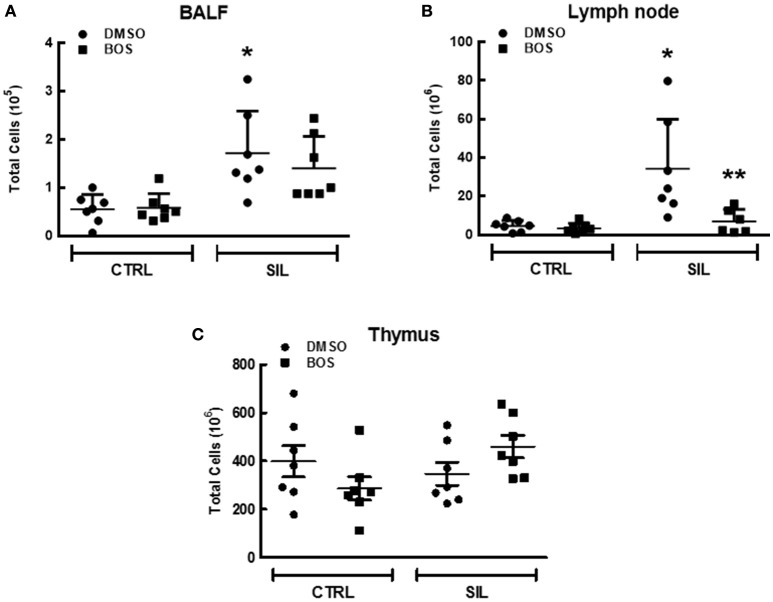
Figure 8.
Total inflammatory cell counts in bronchoalveolar lavage fluid (BALF) (A), lymph node (B), and thymus tissue (C). Black circle, DMSO; black square, BOS. Symbols represent individual animals. Lines represent median (interquartile range) of 6 or 8 animals per group. *Significantly different from C-DMSO (p < 0.05). **Significantly different from SIL-DMSO (p < 0.05).

