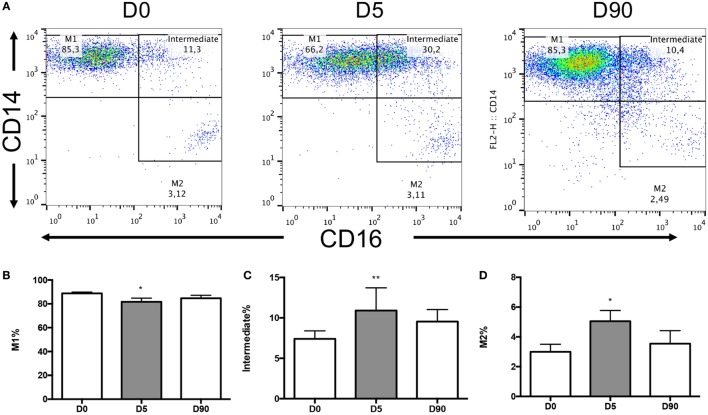
Figure 3.
Monocyte subsets changes over time in circulating blood. (A) The flow cytometry dot plots of an individual patient at day 0 (n = 13), day 5 (n = 11), and day 90 (n = 9) post-surgical intervention. (B) Graph demonstrating the change in the M1 monocyte subpopulation over time showing a decrease at day 5 from baseline (p = 0.0301). (C) Intermediate subpopulation showed a mean 1.47-fold increase at day 5 from baseline (p = 0.0025). (D) M2 subpopulation was observed to have a 1.69-fold increase at day 5 from baseline (p = 0.0257). Day 90 samples were not significantly different from either baseline or day 5 samples. For statistical analysis, two-tailed unpaired t-test was used; *P < 0.05, **P < 0.01, and ***P < 0.001.

