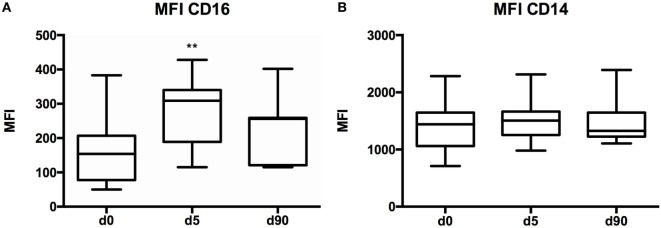
Figure 4.
CD16 and CD14 mean fluorescence index (MFI) values in various time points. (A) Graph showing CD16 MFI differences between the various blood collection time points. There was an increase in CD16 MFI on day 5 when compared to baseline (p = 0.0051). (B) CD14 MFI was not significantly different between day 0, day 5, and day 90. Day 0 (n = 13), day 5 (n = 11), and day 90 (n = 7) samples. For statistical analysis, two-tailed unpaired t-test was used; *P < 0.05, **P < 0.01, and ***P < 0.001.

