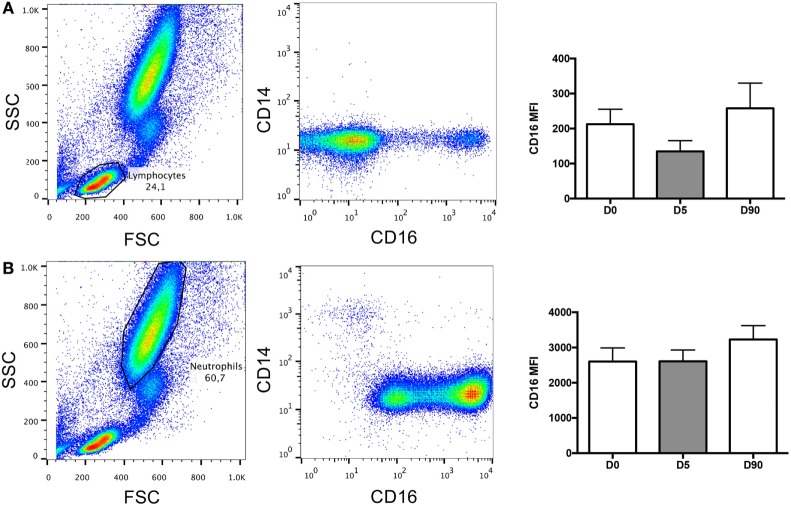
Figure 6.
Lymphocytes and neutrophils contribution to CD16 mean fluorescence index (MFI). (A) Representative images of flow cytometry dot plots showing the lymphocyte population and its contribution to CD16 expression over time (nanoseconds). (B) Representative images of flow cytometry dot plots showing the neutrophil population and its contribution to CD16 expression over time (nanoseconds).

