FIGURE 2.

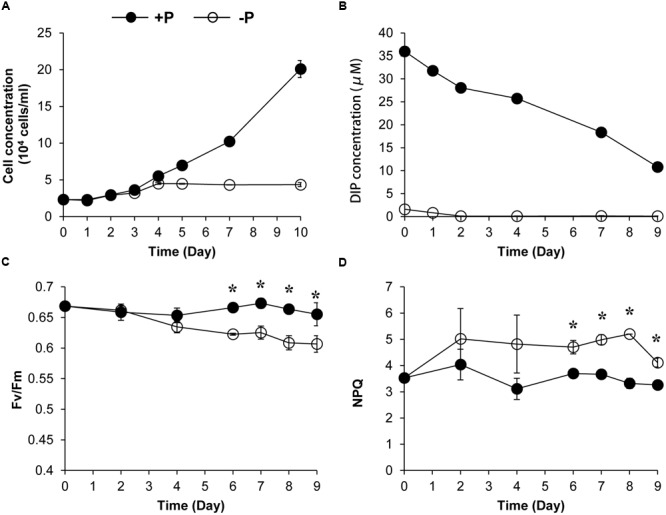
Growth curves (A), dissolved inorganic phosphate (DIP) concentration change (B), Fv/Fm (C), and NPQ capacity (D) of K. veneficum cells grown under +P and –P conditions. Closed circles, P-replete condition; open circles, P-depleted condition. Data shown are means ± SD (error bars) from the triplicated cultures. Asterisks represent that significant differences were detected (p < 0.05) between +P and –P conditions.
