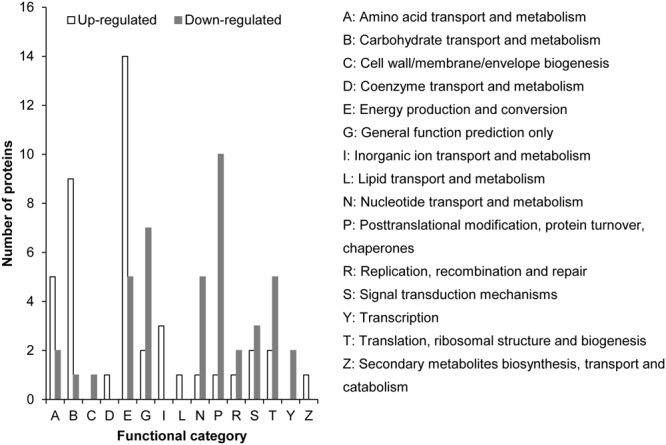
FIGURE 5.

Distribution of up-regulated (empty bar) and down-regulated (solid bar) proteins under –P condition compared to +P condition based on iTRAQ comparative proteomic analysis in K. veneficum. The proteins for which we could not identify a COG functional category were excluded in this analysis.
