
Figure 1.
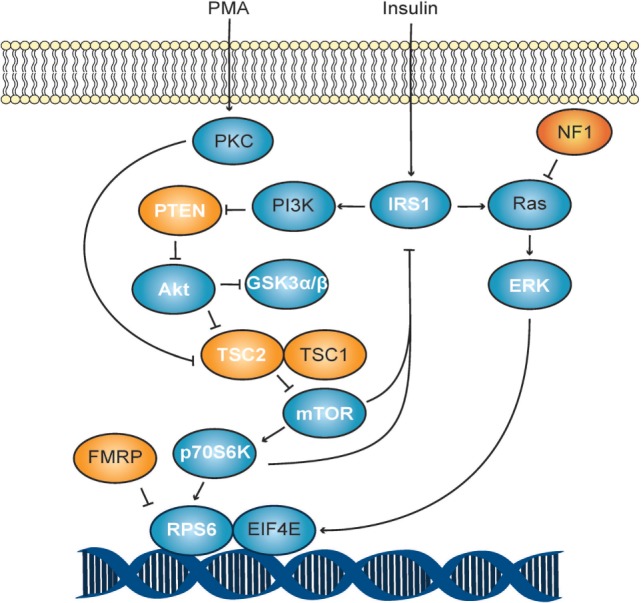
Akt/mTOR signaling schematic. The PI3K pathway in response to stimulation with phorbol myristate acetate (PMA). Autism spectrum disorder-associated mutations are shown in orange, while all others are shown in blue. Molecules measured in this study are shown with white lettering.