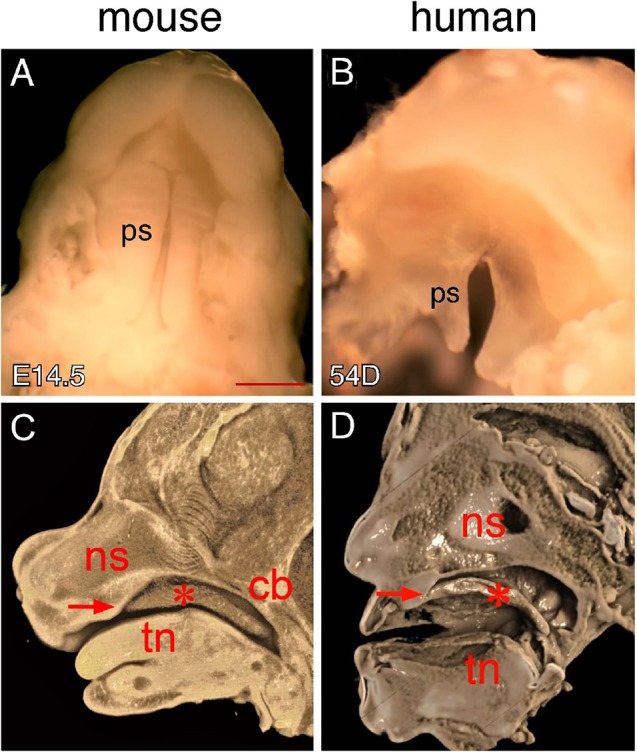
Figure 1.

Comparison of mouse and human secondary palates. (A) Inferior view of newly elevated palatal shelves of an E14.5 mouse embryo. (B) Inferior view of newly elevated palatal shelves of a 54-day human embryo. (C) Virtual mid-sagittal cut through a 3D-rendered Optical Projection Tomography (OPT) scan of an E14.5 mouse embryonic head. (D) Virtual mid-sagittal cut through a 3D rendered microCT scan of a PTAH-stained 54-day human embryonic head. Asterisks in (C,D) indicate elevated palatal shelves. Arrows in (C,D) indicate the junction between the primary and secondary palate. cb, cranial base; ns, nasal septum; ps palatal shelf; tn, tongue. Scale bar in (A) for (A,B), 1 mm.
