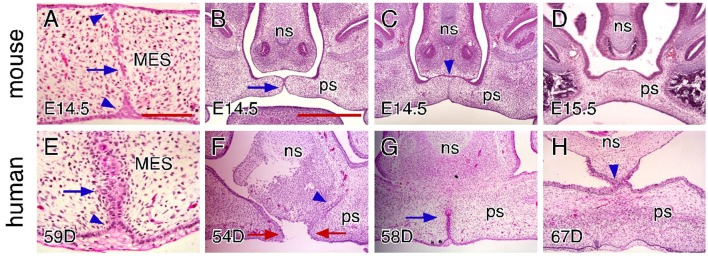
Figure 5.
Comparison of craniofacial tissue interactions during closure of the hard palate in mice and humans. (A) H&E-stained coronal section showing MES degeneration in an E14.5 mouse palate. Arrow indicates epithelial islands and arrowheads indicate the epithelial triangles. (B) H&E-stained coronal section showing the contact of the palatal shelves in the anterior region (arrow) in an E14.5 mouse palate. Note that the palatal shelves are not in contact with the nasal septum. (C) H&E-stained coronal section showing epithelial seam formation between the palate and nasal septum in the anterior region (arrowhead) in an E14.5 mouse palate. Note the degenerated MES at the same region. (D) H&E-stained coronal section showing that the palate does not contact or fuse with the nasal septum in the posterior portions of the anterior region in an E15.5 mouse palate. (E) H&E-stained coronal section showing MES degeneration in a 59-day human palate. Arrow indicates epithelial rosettes and arrowhead indicates the alignment of the basal cells in the epithelial triangle. (F) H&E-stained coronal section showing epithelial seam formation between the palate and nasal septum in the anterior region (arrowhead) in a 54-day human palate. Note the gap between the opposing MEEs (red arrows). (G) H&E-stained coronal section showing partially (and dorsally) degenerated MES in the anterior region (arrow) in a 58-day human palate. Note that the palate completely fuses with the nasal septum. (H) H&E-stained coronal section showing that the palate is also in contact and fuses with the nasal septum in the posterior region in a 67-day human palate. Note the completely fused palate in the same region. ns, nasal septum; ps, palatal shelf. Scale bars in (A) for (A,E), 100 μm; in (B) for (B–D), and (F–H), 500 μm.

