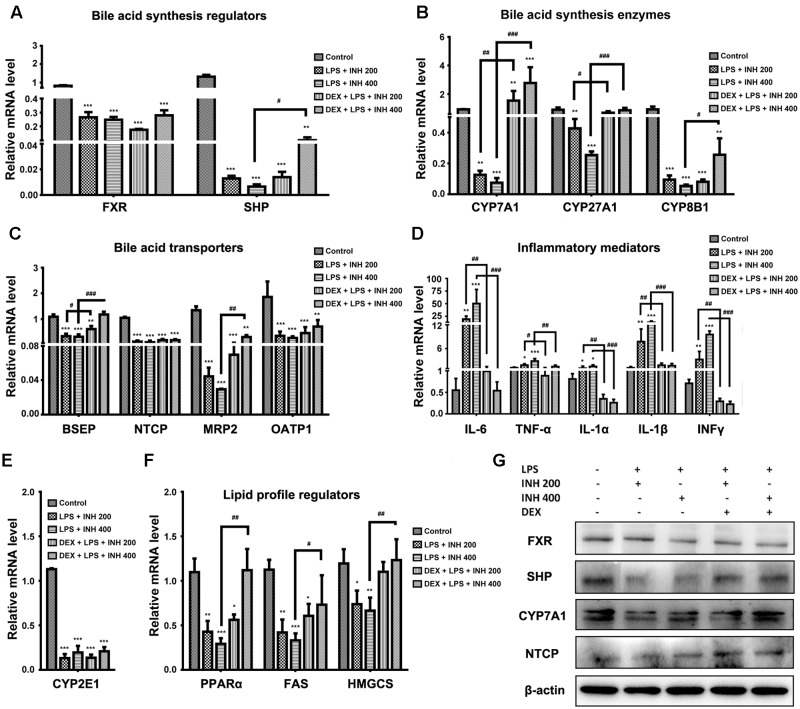
FIGURE 5.
Effects of INH/LPS combination on different targeted genes and proteins profile in absence or presence of DEX. (A) Bile acid regulators FXR and SHP expression. (B) Expression of bile acid synthesis enzymes CYP7A1, CYP27A1, and CYP8B1. (C) Bile acid transporters BSEP, NTCP, MRP2, and OATP1 expression. (D) Inflammatory mediators IL-6, TNFα, IL-1α, IL-1β, and INFγ expression. (E) Expression of CYP2E1. (F) Lipid profile regulators PPARα, FAS, and HMGCS expression. Data were represented as mean ± SD, n = 8 for each bar. ∗P < 0.05, ∗∗P < 0.01, ∗∗∗P < 0.001 versus control, #P < 0.05, ##P < 0.01, ###P < 0.001 versus INH/LPS combination, GAPDH was set as reference control gene. (G) Immunoblotting analysis of different targeted proteins following INH/LPS with or without DEX treatment, β-actin considered as loading control.

