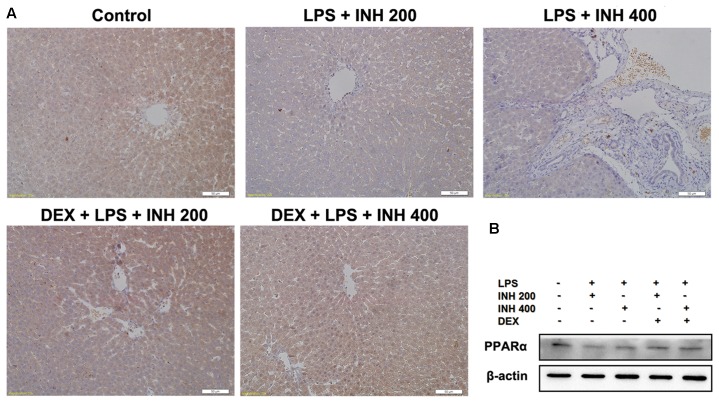
FIGURE 7.
Alterations of PPARα expression in rat liver. (A) Photomicrograph of PPARα in rat liver immunohistochemistry, control group showed brown staining (color indicating PPARα) while INH/LPS-treated rats their PPARα expression was significantly reduce as indicated by color fading. DEX pre-treatment ameliorate PPARα expression after INH/LPS treatment. (B) Total liver protein was probed for PPARα, β-actin considered as loading control.

