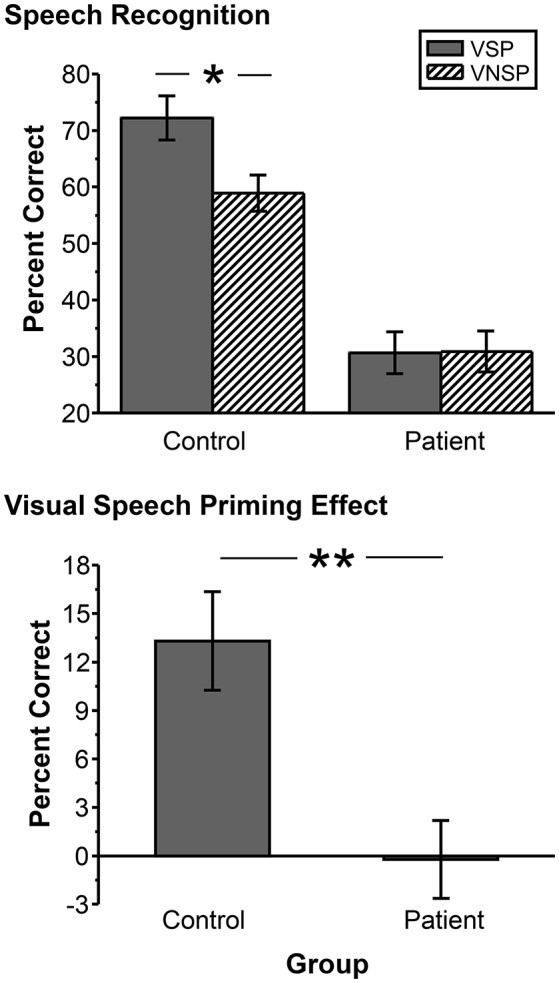
Figure 2.

Upper panel: Comparisons in group-mean percent-correct recognition of the two target keywords against speech masking between the control group and the patient group under the VSP listening condition and the VNSP listening condition (averaged across SMRs of −4 and −8 dB). Lower panel: Difference in the group-mean unmasking effect (VSP effect: difference in percent correct of target speech recognition between VSP and VNSP conditions) between healthy participants and people with schizophrenia (averaged across SMRs of −4 and −8 dB). Error bars indicate the standard errors of the mean. VSP, visual speech priming; VNSP, visual non-speech priming. *p < 0.05, **p < 0.01.
