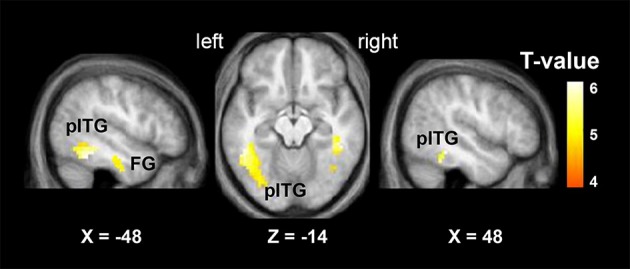
Figure 3.

Brain regions activated by the contrast of “VSP > VNSP” (in healthy people), including the bilateral pITG and bilateral FG. The activation maps were thresholded at p < 0.05 (voxel-wise FDR corrected, T > 4.87) and overlaid on the group-average structural image. FG, fusiform gyrus; pITG, posterior inferior temporal gyrus; VSP, visual speech priming; VNSP, visual non-speech priming.
