Figure 4.
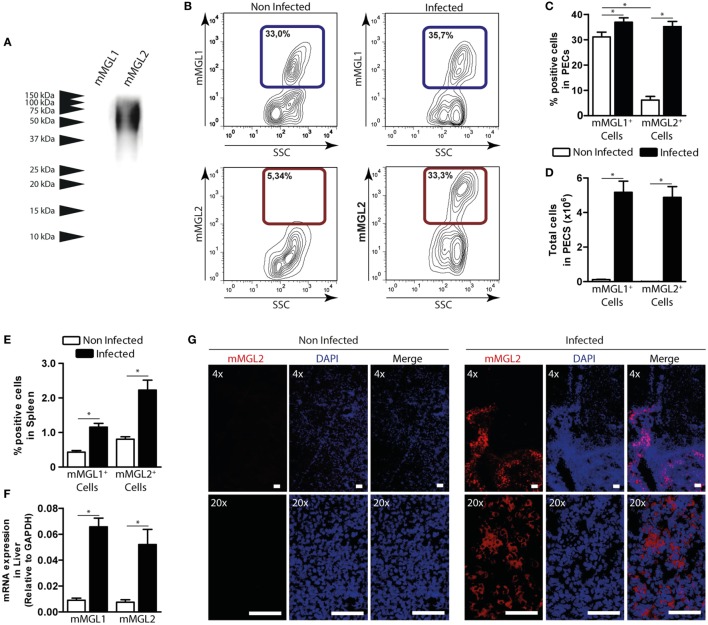
mMGL2+ cells are recruited to the peritoneum during F. hepatica infection. (A) Recognition of mMGL1 and mMGL2 of FhTE by western blotting. (B) Evaluation by flow cytometry of mMGL1+ and mMGL2+ cells in the peritoneal cavity of infected and control mice. (C) Percentage of mMGL1+ or mMGL2+ cells in the peritoneum of infected and control mice. (D) Total cell numbers of mMGL1+ or mMGL2+ cells in the peritoneum of infected and control mice. (E) Percentage of mMGL1+ or mMGL2+ cells in the spleen of infected and control mice. (F) mRNA expression of mMGL1 and mMGL2 in the liver of infected and control animals. (G) MGL2 expression in livers of infected and control animals. A representative figure of three independent experiments is shown (±SD, indicated by error bars). Asterisks indicate statistically significant differences (*p < 0.05). The bar represents 100 μm.

